Education & Matrimonial Preferences in Pakistan
What 3,204 Weddme profiles reveal about how education is used as a search preference in digital matrimony
An anonymized study of saved partner-education search criteria across 3,204 eligible Weddme profiles.
Scope and methodology in brief
This report measures saved partner-education search preferences, not marriages, spouse education, compatibility, or national Pakistani preferences. Findings describe eligible Weddme profiles with saved education preferences.
How this report fits the research library
This report extends Weddme's behavioral research on saved preferences after Marriage Age Preferences in Pakistan, complements the account and family-process findings in Family Participation in Pakistan's Digital Matrimony, and follows the platform-research standards used in the Pakistan Matrimonial Trends Report 2026. For broader digital-rishta context, see Pakistan's Digital Matrimonial Transformation 2026; for practical profile browsing, see the education-based rishta guide.
1. Executive Summary
Education is often discussed in matrimonial search as if it were a single requirement: a degree to match, exceed, or avoid. Weddme's production data shows a more useful pattern. Among profiles that saved partner-education preferences, education was usually recorded as a set of acceptable categories rather than a single ranked qualification.
This report uses an anonymized production snapshot captured on 29 August 2026. The strict eligible platform cohort contained 5,951 active client profiles after quality filters and obvious test-record exclusion. Of those, 3,204 profiles had valid own education and at least one non-empty valid saved partner-education preference.
The strongest behavioral finding is own-education inclusion. Within the 3,204-profile analytical cohort, 2,470 profiles, or 77.09%, included the profile holder's own education category in the acceptable partner-education set. This does not prove that users want someone identical to themselves, and it does not measure actual spouse education. It means that when these profiles saved education search criteria, their own education level was commonly inside the acceptable set.
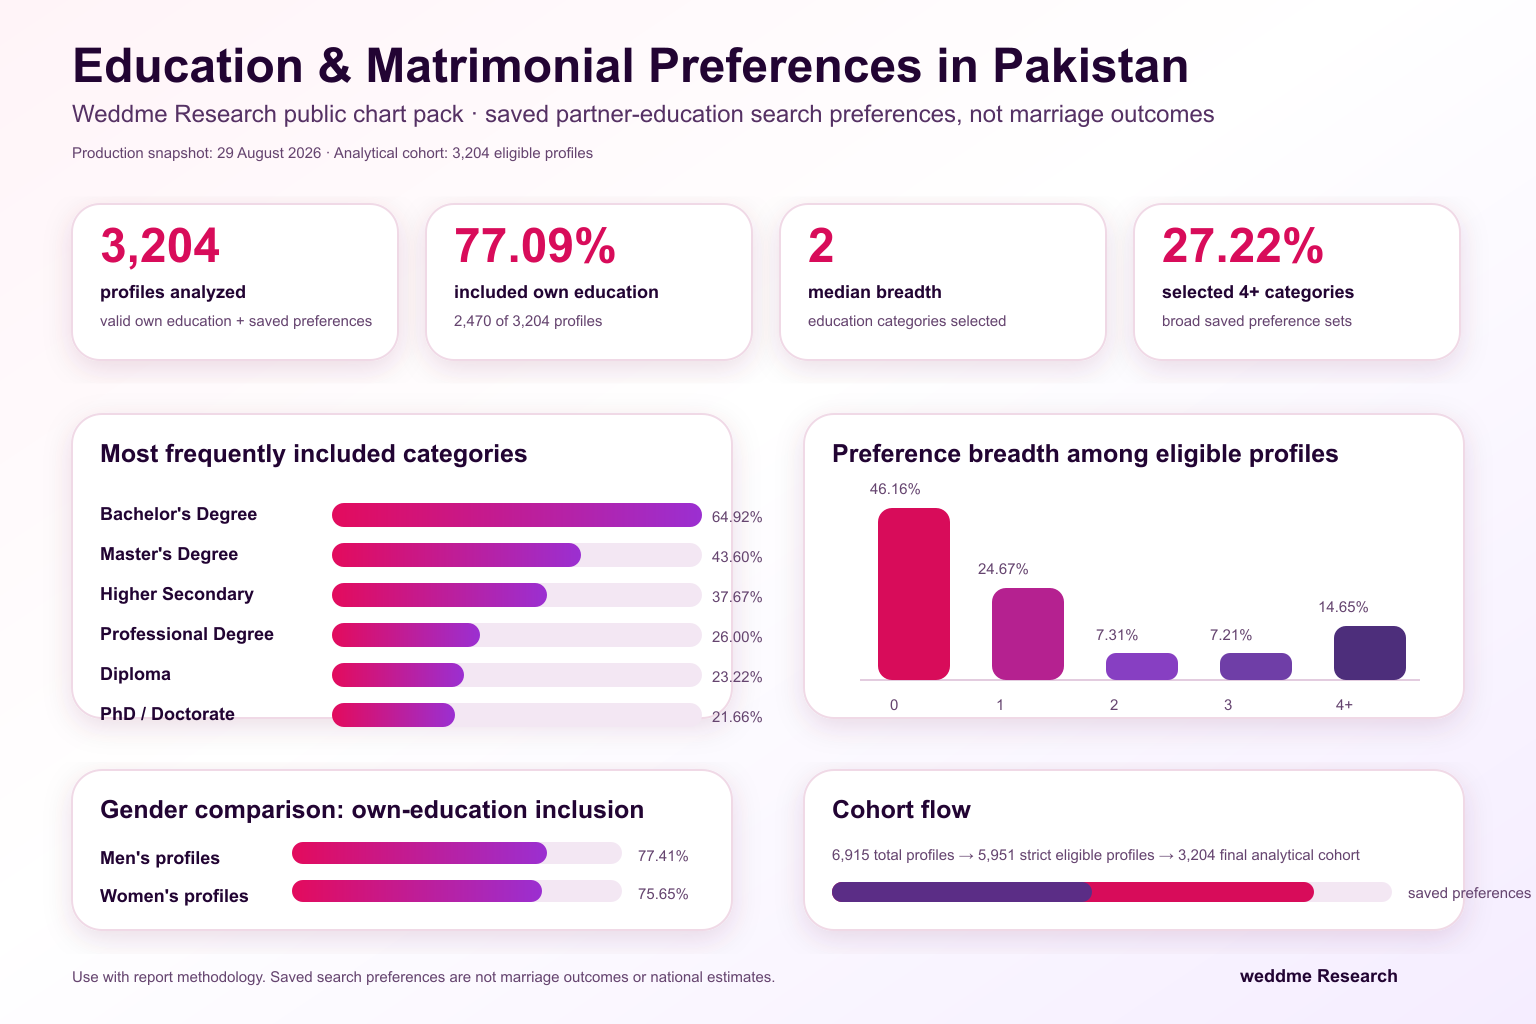
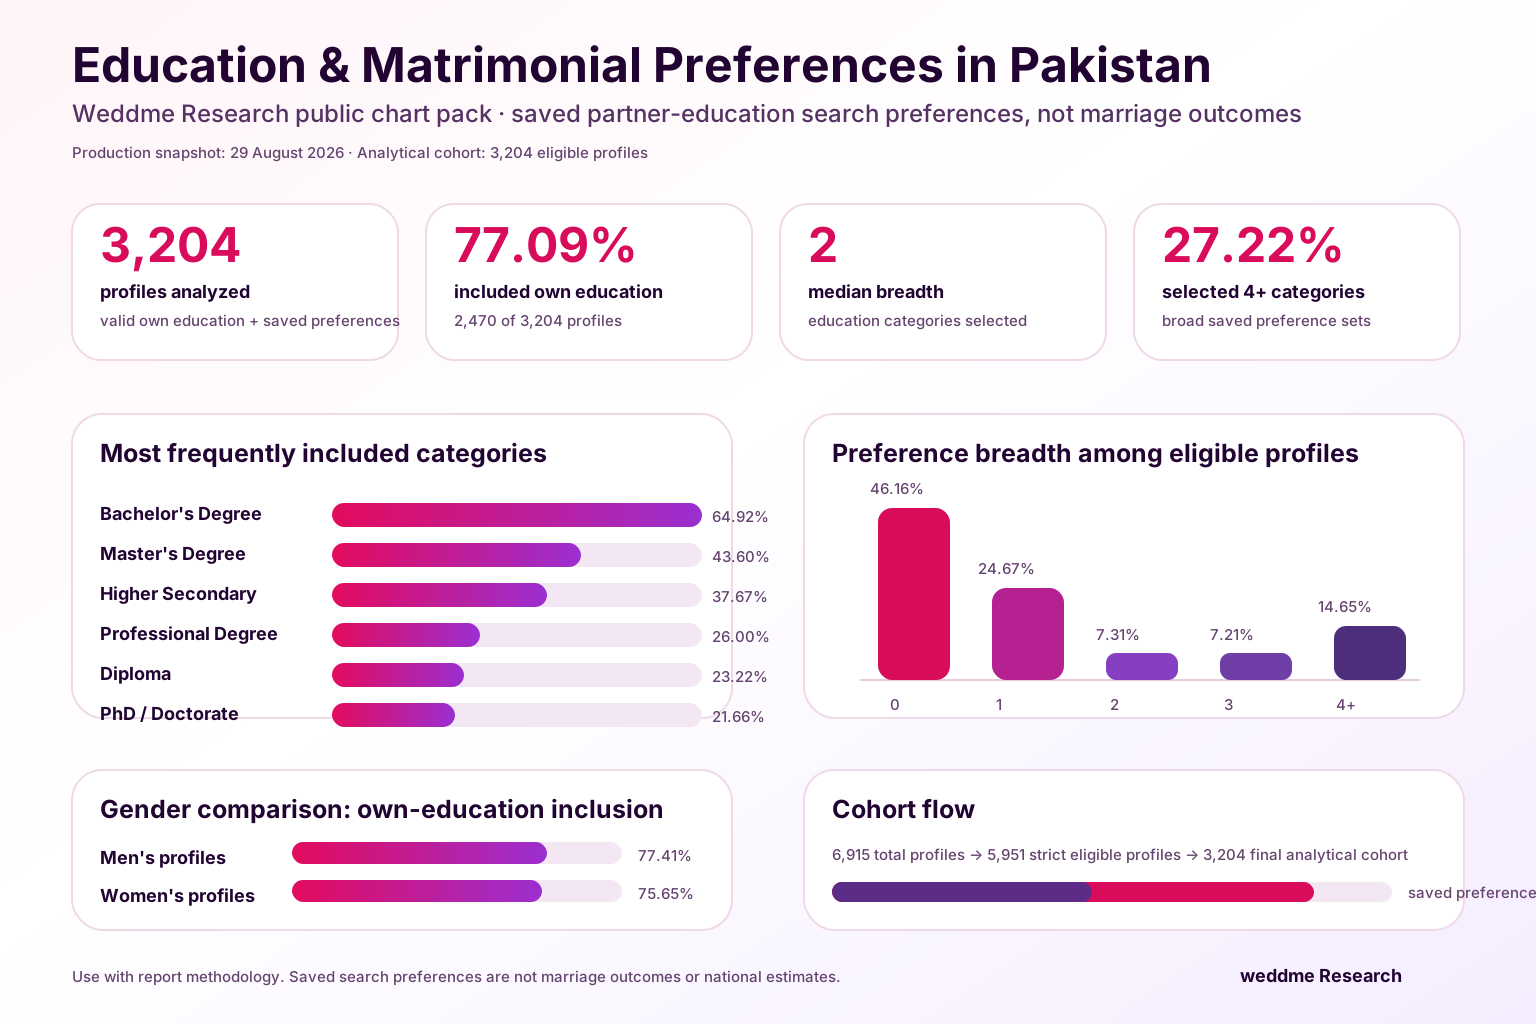
Preference breadth is the second central finding. The median saved partner-education set contained 2 categories. A meaningful broad-search segment also existed: 872 profiles, or 27.22% of the analytical cohort, selected 4 or more education categories.
Bachelor's Degree was the most frequently included partner-education category, appearing in 2,080 saved preference sets, or 64.92% of the preference-bearing cohort. Master's Degree appeared in 43.60%, Higher Secondary in 37.67%, Professional Degree in 26.00%, Diploma in 23.22%, and PhD / Doctorate in 21.66%. Because the field is multi-select, these figures mean “included in the saved acceptable set,” not “ranked first,” “ideal,” or “exclusive.”
Gender differences were more modest than a sensational reading might suggest. Women's profiles were somewhat more likely than men's profiles to have a saved education preference at all, but the effect size was small. Once a saved preference existed, men's and women's profiles differed little in whether they included their own education level: 77.41% for men's profiles and 75.65% for women's profiles.
The formal-education direction analysis also supports a careful interpretation. Among profiles whose own education and saved partner-education preferences could be compared within a formal academic ladder, the single most common formal-only pattern was selecting only the same education level as the profile holder.
Professional and religious education categories require special care. Weddme's product taxonomy includes Professional Degree, Dars-e-Nizami, Mufti, Qari, Alim, Fazil, Muhaddith, Mufassir, Faqih, Shaykh, Allama, and Imam. These should not be forced into the same ordinal hierarchy as Secondary School, Higher Secondary, Diploma, Bachelor's Degree, Master's Degree, and PhD / Doctorate.
The main conclusion is behavioral: education preferences in digital matrimony are often structured as sets of acceptable qualifications, and most preference-bearing Weddme profiles include the member's own education level within that set.
2. Key Findings
| Finding | Result | Interpretation |
|---|---|---|
| Final analytical cohort | 3,204 profiles | Eligible profiles with valid own education and a non-empty valid saved partner-education preference |
| Own education included | 77.09% | Most preference-bearing profiles included their own education level in the acceptable partner set |
| Median preference breadth | 2 categories | Education search was often a small set, not a single fixed credential |
| Broad education criteria | 27.22% | More than one-quarter selected 4 or more education categories |
| Bachelor's Degree included | 64.92% | Most frequently included partner-education category, not an exclusive or ranked preference |
| Gender similarity | 77.41% vs 75.65% | Men's and women's profiles differed little in own-education inclusion |
3. Why Education Preferences Matter in Digital Matrimony
Education can carry several meanings in matrimonial search. It may signal academic background, perceived compatibility, family expectations, class position, career trajectory, religious training, or practical communication style. It may also act as a quick filter when families are comparing many profiles.
That does not mean education alone determines compatibility or marriage success. A saved education preference cannot measure temperament, values, religious practice, consent, household expectations, financial behavior, communication style, or family fit.
Still, education preferences matter because they shape discovery. If a platform asks members to save acceptable partner-education categories, those selections influence which profiles appear relevant and how broad or narrow the initial search becomes.
Weddme's data is useful because it measures a defined digital behavior: saved search criteria. It does not replace demographic surveys or qualitative research, but it adds evidence about how some active matrimonial searchers structure the education dimension of discovery.
This report also builds on prior Weddme Research work. Marriage Age Preferences in Pakistan established the same core distinction between saved search preferences and outcomes. Family Participation in Pakistan's Digital Matrimony provides context for why a saved preference may reflect an account or family-assisted search process, not always one individual acting alone. The earlier Pakistan Matrimonial Trends Report 2026 included an initial overview of matrimonial preference behavior, while Pakistan's Digital Matrimonial Transformation 2026 gives broader product and market context for digital rishta search.
4. What This Study Measures
A saved education preference is a search criterion. It is not an observed spouse outcome.
Weddme Research, 2026
This report measures saved partner-education preferences attached to eligible Weddme profiles.
| Item | Meaning in this report |
|---|---|
| Own education | The profile holder's education level stored on user_profiles.education_level |
| Saved partner education | The multi-select education preference stored under user_profile_preferences.category = 'education' |
| Included category | A partner-education category selected inside the saved acceptable set |
| Own-education inclusion | Whether the profile holder's own education category appears in their saved partner-education set |
| Preference breadth | Number of education categories selected in the saved partner-education set |
| Does not measure | Actual marriages, spouse education, attraction, compatibility, user motives, or national Pakistani preferences |
The partner-education field is multi-select. A profile can include Bachelor's Degree and Master's Degree together, or include several formal, professional, and religious categories. Therefore, category percentages sum above 100%.
5. Dataset and Sample Flow
The analysis uses an anonymized production snapshot captured on 29 August 2026 at 13:00:35 Pakistan Standard Time. All public findings are grouped. No names, emails, phone numbers, photographs, profile IDs, message contents, payment records, biographies, or row-level records are included.
| Stage | Profiles |
|---|---|
| Total profiles in production | 6,915 |
| Active client profiles before quality filters | 6,422 |
| Strict eligible profiles before test-record exclusion | 5,953 |
| Obvious test-like records excluded | 2 |
| Strict eligible profiles after exclusion | 5,951 |
| Eligible profiles with valid own education | 5,947 |
| Eligible profiles with any education-preference row | 3,297 |
| Eligible profiles with non-empty valid education preference | 3,204 |
| Final analytical cohort | 3,204 |
Eligibility required:
- active client user;
- active profile;
- neither user nor profile deleted;
- valid user;
- user not flagged;
- clean risk state;
- obvious active test-like records excluded.
The completion rate belongs in methodology: 3,204 of 5,951 strict eligible profiles had a non-empty valid saved education preference. The report's main findings describe those 3,204 preference-bearing profiles.
6. Product Mechanics and Data Validation
The education preference is a saved search preference. It is not an observed outcome.
Weddme's current product flow treats education preference as a multi-select step. Users can save the step after selecting at least one category, but the step can also be skipped. No automatic preselection or default partner-education value was found in the audited web/mobile onboarding logic.
This matters for interpretation:
- a saved education category means it was included in the acceptable search set;
- a missing row or empty array means no non-empty saved education preference was observed;
- missing preference data should not be interpreted as indifference;
- selected categories are not ranked;
- selecting all categories likely means broad criteria, not equal interest in every category.
Data quality checks:
| Check | Profiles |
|---|---|
| Eligible profiles | 5,951 |
| Missing own education | 3 |
| Invalid own education key | 1 |
| No education-preference row | 2,654 |
| Empty education preference array | 93 |
| Invalid preference values | 0 |
| Selected all 18 education categories | 67 |
Own education was nearly complete in the strict eligible cohort. Partner-education preference completion was partial, which is why this report focuses on the 3,204 profiles with non-empty valid saved education preferences.
7. Education Taxonomy
Weddme's active production education taxonomy contains formal, professional, and religious categories.
| Category | Type | Ordinal use |
|---|---|---|
| Secondary School | Formal education | Can be used in formal hierarchy |
| Higher Secondary | Formal education | Can be used in formal hierarchy |
| Diploma | Formal education | Can be used in formal hierarchy |
| Bachelor's Degree | Formal education | Can be used in formal hierarchy |
| Master's Degree | Formal education | Can be used in formal hierarchy |
| PhD / Doctorate | Formal education | Can be used in formal hierarchy |
| Professional Degree | Professional credential | Not ranked in formal hierarchy |
| Dars-e-Nizami | Religious education | Not ranked in formal hierarchy |
| Mufti | Religious education | Not ranked in formal hierarchy |
| Qari | Religious education | Not ranked in formal hierarchy |
| Alim | Religious education | Not ranked in formal hierarchy |
| Fazil | Religious education | Not ranked in formal hierarchy |
| Muhaddith | Religious education | Not ranked in formal hierarchy |
| Mufassir | Religious education | Not ranked in formal hierarchy |
| Faqih | Religious education | Not ranked in formal hierarchy |
| Shaykh | Religious education | Not ranked in formal hierarchy |
| Allama | Religious education | Not ranked in formal hierarchy |
| Imam | Religious education | Not ranked in formal hierarchy |
Only the formal education categories support a cautious below / same / above comparison. Professional and religious credentials are reported as included categories but are not ranked against Bachelor's, Master's, or PhD categories.
8. Own Education Among Eligible Profiles
Denominator: 5,951 strict eligible profiles.
| Own education | Profiles | Share |
|---|---|---|
| Bachelor's Degree | 2,622 | 44.06% |
| Master's Degree | 1,205 | 20.25% |
| Higher Secondary | 1,023 | 17.19% |
| Diploma | 428 | 7.19% |
| Secondary School | 344 | 5.78% |
| Professional Degree | 201 | 3.38% |
| PhD / Doctorate | 91 | 1.53% |
| Dars-e-Nizami | 18 | 0.30% |
| Qari | 9 | 0.15% |
Small religious-education subgroups are shown here only as aggregate descriptive context. They are not used for public subgroup comparisons.
9. Own-Education Inclusion
77.09% of profiles with saved education preferences included their own education level in the acceptable partner set.
Weddme Research, 2026
The clearest behavioral finding is that most profiles with saved education preferences included their own education category in the acceptable partner-education set.
| Metric | Profiles | Share |
|---|---|---|
| Analytical cohort | 3,204 | 100.00% |
| Own education included | 2,470 | 77.09% |
| Own education not included | 734 | 22.91% |
This should not be simplified into “people want someone like themselves” without qualification. The database records search criteria, not the reason behind them. A profile may include its own education level because the search is broad, because the category feels acceptable, because a family member selected it, or because the member sees it as a practical baseline. The data cannot distinguish those motives.
What the data can support is narrower and stronger: within this Weddme cohort, saved education search sets usually included the profile holder's own education level.
10. Preference Breadth
The median saved education preference contained 2 categories, showing that education search is often a set rather than a single credential.
Weddme Research, 2026
Education preferences were not usually single-category filters. Among profiles with a non-empty saved education preference, the median set contained 2 categories.
| Number of selected education categories | Profiles | Share of all eligible profiles |
|---|---|---|
| 0 | 2,747 | 46.16% |
| 1 | 1,468 | 24.67% |
| 2 | 435 | 7.31% |
| 3 | 429 | 7.21% |
| 4+ | 872 | 14.65% |
Among the 3,204 profiles with non-empty saved education preferences:
| Breadth measure | Value |
|---|---|
| Mean selected categories | 3.06 |
| Q1 | 1 |
| Median | 2 |
| Q3 | 4 |
| Minimum | 1 |
| Maximum | 18 |
The 4+ category group is important. It shows that a sizeable minority of preference-bearing profiles used education criteria broadly rather than narrowly. In the final public narrative, this should sit alongside the own-education inclusion finding.
11. Most Frequently Included Partner-Education Categories
Denominator: 3,204 profiles with non-empty valid saved education preferences. Because the field is multi-select, shares sum above 100%.
| Partner-education category included | Profiles | Share |
|---|---|---|
| Bachelor's Degree | 2,080 | 64.92% |
| Master's Degree | 1,397 | 43.60% |
| Higher Secondary | 1,207 | 37.67% |
| Professional Degree | 833 | 26.00% |
| Diploma | 744 | 23.22% |
| Secondary School | 730 | 22.78% |
| PhD / Doctorate | 694 | 21.66% |
| Dars-e-Nizami | 390 | 12.17% |
| Alim | 302 | 9.43% |
| Allama | 224 | 6.99% |
| Qari | 204 | 6.37% |
| Mufti | 182 | 5.68% |
| Fazil | 169 | 5.27% |
| Muhaddith | 135 | 4.21% |
| Faqih | 132 | 4.12% |
| Mufassir | 132 | 4.12% |
| Shaykh | 127 | 3.96% |
| Imam | 112 | 3.50% |
Bachelor's Degree was the most frequently included category. It should not be described as the “most preferred qualification,” because the field is not ranked and many profiles selected multiple categories.
12. Common Saved Education Combinations
The most common saved combination was Bachelor's Degree alone, followed by Higher Secondary alone, Master's Degree alone, and Bachelor's + Master's together.
| Saved partner-education combination | Profiles | Share |
|---|---|---|
| Bachelor's Degree | 665 | 20.76% |
| Higher Secondary | 299 | 9.33% |
| Master's Degree | 196 | 6.12% |
| Bachelor's Degree + Master's Degree | 189 | 5.90% |
| Secondary School | 157 | 4.90% |
| Bachelor's Degree + Master's Degree + PhD / Doctorate + Professional Degree | 130 | 4.06% |
| Professional Degree | 70 | 2.18% |
| Bachelor's Degree + Master's Degree + PhD / Doctorate | 68 | 2.12% |
| Secondary School + Higher Secondary | 68 | 2.12% |
| Bachelor's Degree + Master's Degree + Professional Degree | 67 | 2.09% |
| All 18 categories | 67 | 2.09% |
The combination table shows both narrow and broad behavior. Some profiles saved a single category. Others saved adjacent formal categories or a broad set crossing formal, professional, and religious options.
13. Formal-Education Direction Patterns
For a limited subset, own education and saved partner-education preferences can be compared within a formal hierarchy:
Secondary School → Higher Secondary → Diploma → Bachelor's Degree → Master's Degree → PhD / Doctorate.
Professional and religious categories are excluded from this hierarchy.
Among profiles whose own education and saved preferences could be compared within the formal education hierarchy, the single most common pattern was selecting only the same education level as the profile holder.
| Formal-only direction pattern | Profiles | Share |
|---|---|---|
| Own only | 892 | 42.23% |
| Entirely below own | 369 | 17.47% |
| Below + own | 296 | 14.02% |
| Own + above | 211 | 9.99% |
| Below + own + above | 190 | 9.00% |
| Entirely above own | 151 | 7.15% |
This table should be interpreted cautiously. It applies only where both own education and selected partner-education categories fit the formal hierarchy.
14. Gender Patterns
Gender differences in preference completion existed, but they were small by effect size. Own-education inclusion was very similar across men's and women's profiles.
| Gender of profile holder | Eligible profiles | Preference cohort | Completion share | Own education included |
|---|---|---|---|---|
| Men's profiles | 5,017 | 2,629 | 52.40% | 77.41% |
| Women's profiles | 934 | 575 | 61.56% | 75.65% |
The gender × preference-completion test produced Cramér's V = 0.0668, a small effect. The gender × own-education-inclusion test produced Cramér's V = 0.0160, a negligible effect.
A responsible public summary is: men's and women's profiles differed little in whether their saved partner-education set included their own education level.
15. Age Patterns
Preference completion and own-education inclusion varied somewhat by age group, but effect sizes were small.
| Age group | Eligible profiles | Preference cohort | Completion share | Median breadth | Own education included |
|---|---|---|---|---|---|
| 18–24 | 1,221 | 661 | 54.14% | 1 | 76.40% |
| 25–29 | 2,884 | 1,515 | 52.53% | 2 | 78.94% |
| 30–34 | 1,077 | 602 | 55.90% | 2 | 76.91% |
| 35–39 | 400 | 240 | 60.00% | 2 | 71.25% |
| 40–44 | 207 | 114 | 55.07% | 3 | 74.56% |
| 45+ | 160 | 72 | 45.00% | 2 | 69.44% |
The age group × preference-completion test produced Cramér's V = 0.0504, a small effect. These age results should be treated as descriptive platform findings, not causal explanations.
16. City Patterns
The largest city cohorts showed moderate variation, but city findings should not be treated as headline claims without controlling for gender, age, education, and acquisition composition.
| City | Eligible profiles | Preference cohort | Completion share | Median breadth | Own education included |
|---|---|---|---|---|---|
| Lahore | 2,316 | 1,216 | 52.50% | 2 | 77.96% |
| Islamabad | 903 | 532 | 58.91% | 2 | 76.50% |
| Rawalpindi | 838 | 500 | 59.67% | 2 | 74.00% |
| Faisalabad | 176 | 86 | 48.86% | 2 | 76.74% |
| Gujranwala | 98 | 55 | 56.12% | 1 | 81.82% |
City-level results are useful for context, but the strongest public findings remain own-education inclusion and preference breadth.
17. Profession-Level Patterns
Profession results are included as appendix-level context only. Raw profession labels require normalization, and profession groups are confounded by gender, age, education, and profile composition.
The public report should not make profession-specific headline claims such as “technology professionals prefer their own education level.” A stronger profession analysis would require a separately reviewed occupational taxonomy and confounding checks.
18. What These Findings Mean
The findings suggest that education preferences in digital matrimony are often more flexible than single-credential narratives imply.
Three patterns matter together:
- Most preference-bearing profiles included their own education level.
- The median saved preference set contained 2 education categories.
- More than one-quarter of preference-bearing profiles selected 4 or more categories.
This combination points to education as a boundary-setting tool rather than a simple one-degree target. Some profiles are narrow. Many are not. The platform behavior is better described as acceptable-set construction than as a single “preferred degree.”
19. What the Data Cannot Tell Us
This report cannot tell us:
- who selected the preference when a family member was involved;
- why a category was selected;
- whether the profile holder would accept every person inside the saved set;
- whether families later changed their minds offline;
- whether a match, engagement, or marriage occurred;
- the education level of actual spouses;
- whether education caused any search or relationship outcome;
- national preferences among all Pakistanis.
These limits are not weaknesses in the data. They define what the data is suited to answer.
20. Methodological Notes
The unit of analysis is the profile. The main analytical cohort contains 3,204 eligible Weddme profiles with valid own education and at least one non-empty valid saved education preference.
Saved education preferences are stored as JSON arrays of display labels under user_profile_preferences.category = 'education'. Own education is stored as a slug key on user_profiles.education_level. The analysis normalized these into one education taxonomy for aggregate reporting.
Own-education inclusion was calculated by checking whether the normalized own education category appeared inside the normalized saved partner-education array.
Preference breadth was calculated as the number of valid education categories selected in the saved partner-education array.
Formal-direction analysis used only formal ordinal categories. Professional and religious credentials were not ranked against formal academic degrees.
Public subgroup reporting uses grouped data only. Subgroup percentages are suppressed or avoided where denominators are too small for responsible publication.
21. Privacy and Ethics
This report publishes aggregate findings only. It excludes names, contact details, photographs, profile IDs, exact user-level timestamps, messages, payments, biographies, and row-level data.
Findings should be described as Weddme platform findings from a defined eligible cohort. They should not be presented as a national survey, as claims about all Pakistanis, or as evidence of actual marriage outcomes.
22. Data and Citation Note
Suggested citation:
Weddme Research Team. (2026). Education & Matrimonial Preferences in Pakistan: What 3,204 Weddme Profiles Reveal About How Education Is Used as a Search Preference in Digital Matrimony. Weddme Research & Insights.
When citing the findings, use language such as “within the analyzed Weddme cohort,” “profiles with saved education preferences,” and “included in the saved partner-education set.”
Avoid language such as “Pakistanis prefer,” “most preferred qualification,” “marriage outcome,” “spouse education,” or “education predicts compatibility.”
23. FAQ
Does this report show what education people want in a spouse?
Not exactly. It shows which education categories were included in saved partner-education search criteria. It does not measure actual spouses, final decisions, or ranked ideals.
Why do category percentages add up to more than 100%?
The education preference is multi-select. A profile can include several acceptable education categories.
Is Bachelor's Degree the most preferred qualification?
No. Bachelor's Degree was the most frequently included category. The data does not rank preferences.
Does own-education inclusion mean people only want someone with the same education?
No. It means the profile holder's own education category appeared inside the saved acceptable set. Many saved sets included more than one category.
Are these national findings for Pakistan?
No. These are findings from eligible Weddme profiles in a defined production snapshot.
24. References
- Weddme Research Team. 2026. Marriage Age Preferences in Pakistan. Used as a methodological reference for interpreting saved preferences as search criteria rather than outcomes.
- Weddme Research Team. 2026. Family Participation in Pakistan's Digital Matrimony. Used as internal context for account-level and family-assisted profile behavior.
- Weddme Research Team. 2026. Pakistan Matrimonial Trends Report 2026. Used as prior Weddme platform research context; this education report uses a newer production snapshot and does not reuse its older counts.
- Weddme Research Team. 2026. Pakistan's Digital Matrimonial Transformation 2026. Used as broader digital-matrimony context.
- National Institute of Population Studies and ICF. Pakistan Demographic and Health Survey 2017–18. https://dhsprogram.com/pubs/pdf/FR354/FR354.pdf
- Pakistan Bureau of Statistics. Pakistan Social and Living Standards Measurement / Household Integrated Economic Survey reports. https://www.pbs.gov.pk/pslm-3/
- Pakistan Bureau of Statistics. Household Integrated Economic Survey 2024–25 Social Report. https://www.pbs.gov.pk/wp-content/uploads/2020/07/PSLM_Report_2024-25-Social-2.pdf
- “Who Marries Whom in Pakistan,” International Population Conference 2009 paper. https://ipc2009.popconf.org/papers/91555
- “Digitized Matchmaking,” working paper on online matrimonial profile management and desired characteristics. https://mathieuferry.github.io/PondicherryWorkshop/material/wp/Digitized%20Matchmaking_WP19.pdf
- Frontiers in Sociology. 2023. Article on education and women's mate selection in Malakand Division. https://www.frontiersin.org/journals/sociology/articles/10.3389/fsoc.2023.1273297/full
Appendix A. Profession Context
Profession-level findings are retained as appendix context because raw labels require normalization and the groups are compositionally confounded.
| Profession group | Eligible profiles | Preference cohort | Completion share | Mean breadth | Own education included |
|---|---|---|---|---|---|
| Other specific professions | 1,417 | 774 | 54.62% | 2.95 | 73.39% |
| Business / self-employed | 866 | 427 | 49.31% | 3.23 | 79.39% |
| Corporate / sales / management | 681 | 357 | 52.42% | 3.45 | 78.71% |
| Other / missing profession | 553 | 276 | 49.91% | 2.72 | 73.19% |
| Technology | 539 | 297 | 55.10% | 3.37 | 84.18% |
| Finance / accounting | 434 | 252 | 58.06% | 3.06 | 78.17% |
| Government / defence | 401 | 227 | 56.61% | 3.18 | 77.53% |
| Education / teaching | 401 | 243 | 60.60% | 2.61 | 78.60% |
| Engineering, non-IT | 336 | 170 | 50.60% | 3.35 | 71.76% |
| Healthcare | 323 | 181 | 56.04% | 2.46 | 79.56% |
Suggested citation
Weddme Research Team. (2026). Education & Matrimonial Preferences in Pakistan: What 3,204 Weddme Profiles Reveal About How Education Is Used as a Search Preference in Digital Matrimony. Weddme Research & Insights. https://weddme.pk/research/education-matrimonial-preferences-pakistan
Describe the figures as saved partner-education preference findings from an eligible Weddme platform cohort, not as spouse education, marriage outcomes, or national estimates for Pakistan.
Reporting resources
Download the public summary, editorial cover, chart pack, and aggregate publication data. The public data contains only grouped findings used in this report.