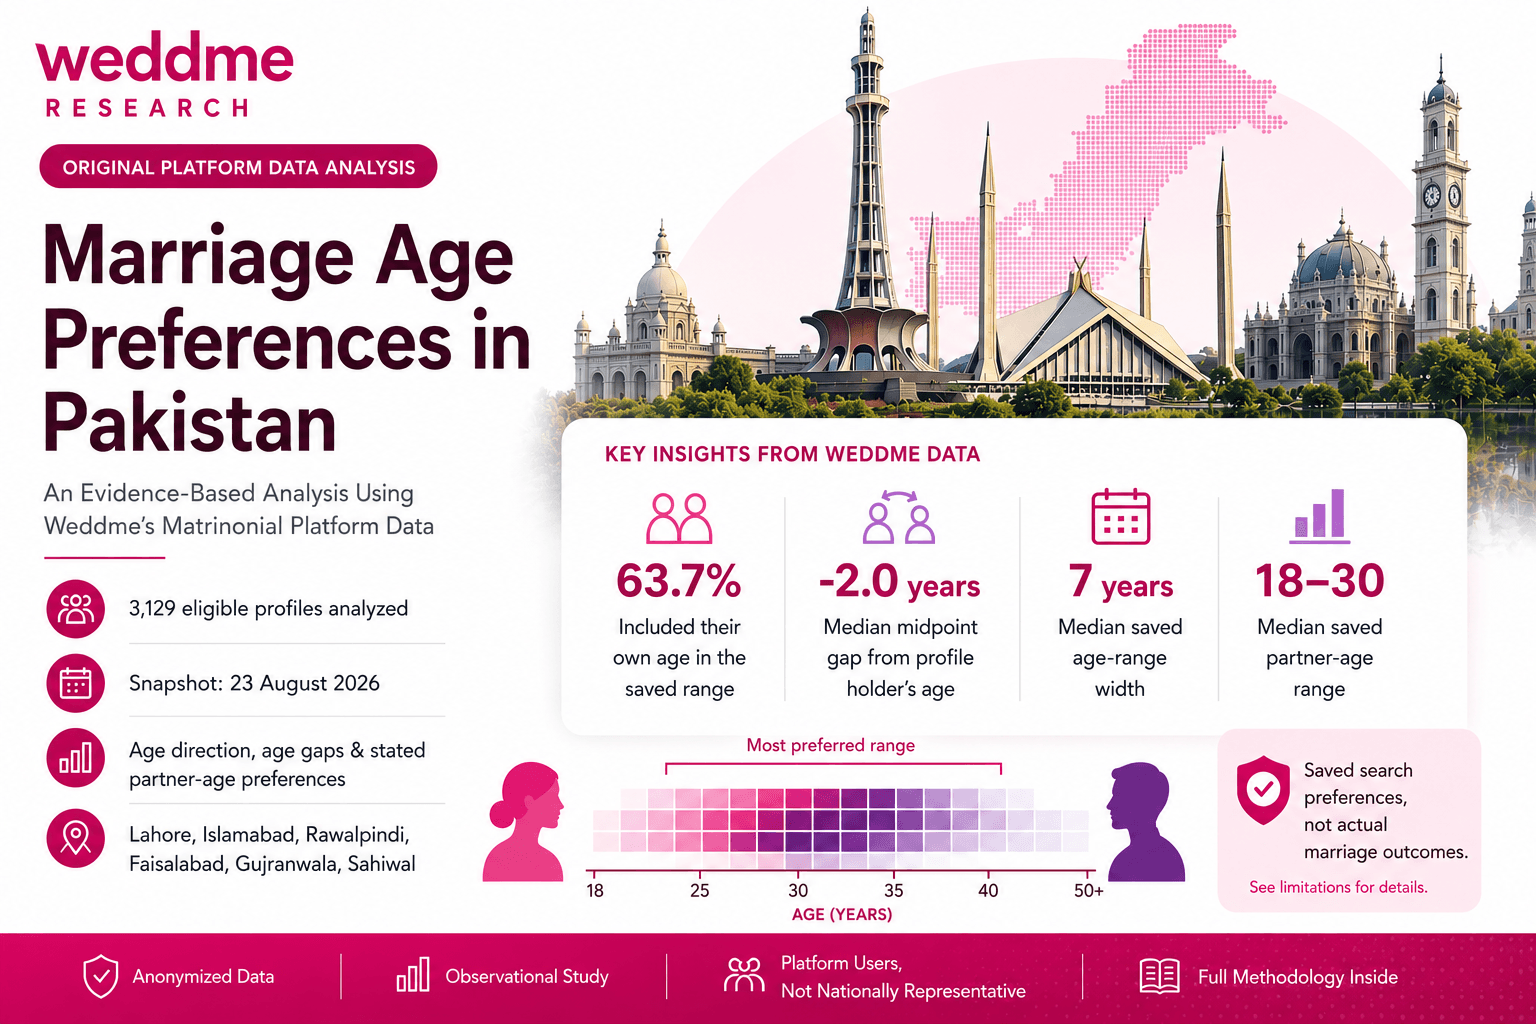
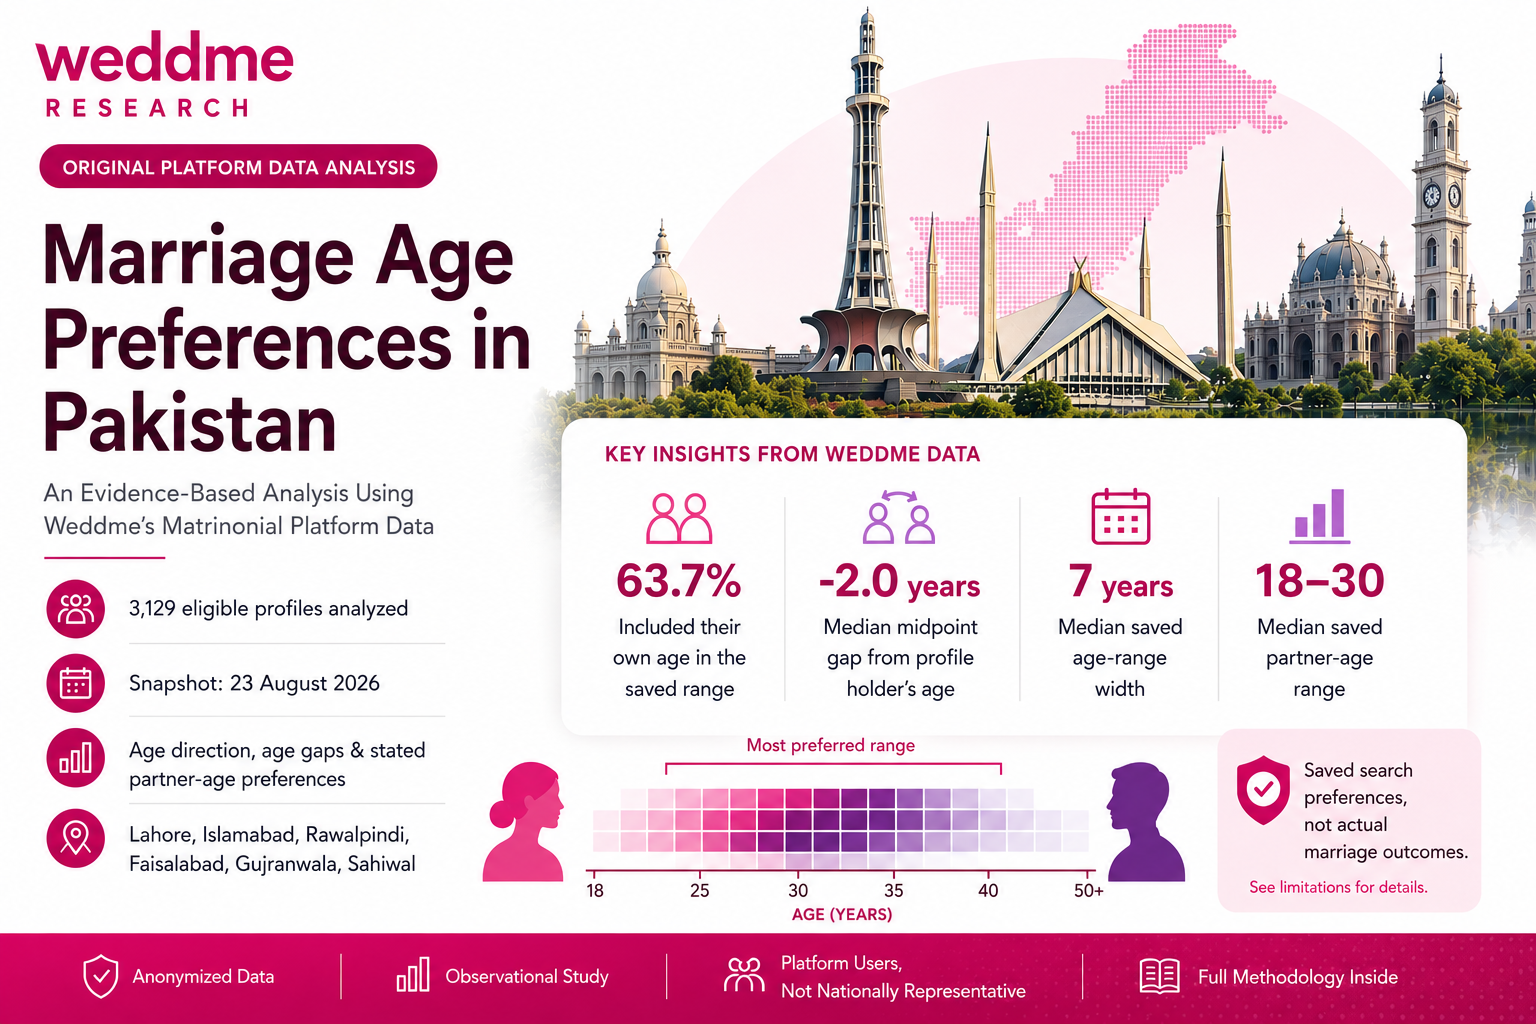
Marriage Age Preferences in Pakistan
An Evidence-Based Analysis Using Weddme's Matrimonial Platform Data
An anonymized study of saved partner-age search ranges across 3,129 eligible Weddme profiles.
Scope and methodology in brief
This report measures saved partner-age search ranges, not actual marriages or spouse-age gaps. Findings describe eligible Weddme profiles with saved age preferences and should not be generalized to all Pakistanis.
How this report fits the research library
This report extends earlier Weddme analysis of saved preferences in the Pakistan Matrimonial Trends Report 2026 and complements the family-process findings in Family Participation in Pakistan's Digital Matrimony. For practical search context, see the age-based rishta guide.
1. Executive Summary
Marriage-age expectations are often discussed as if they were single numbers: the “right” age for a bride, the “right” age for a groom, or the “acceptable” gap between spouses. Digital matrimonial search shows a different structure. Weddme members do not usually record a single preferred age. They save acceptable age ranges.
This report asks what those saved age ranges reveal about the structure of digital matrimonial search. It uses an anonymized, read-only production snapshot of eligible Weddme profiles captured on 23 August 2026. The main cohort contained 5,783 eligible active client profiles. Of these, 5,779 had valid own-age data, 3,131 had an age-preference record, and 3,129 had both valid own age and at least one valid saved partner-age band.
The analysis treats saved age preferences as search parameters. They are not observed spouse ages and should not be interpreted as marriage outcomes. A stored range also cannot reveal who selected it, why it was selected, whether a family member influenced it, or whether the person represented would accept every profile inside that range.
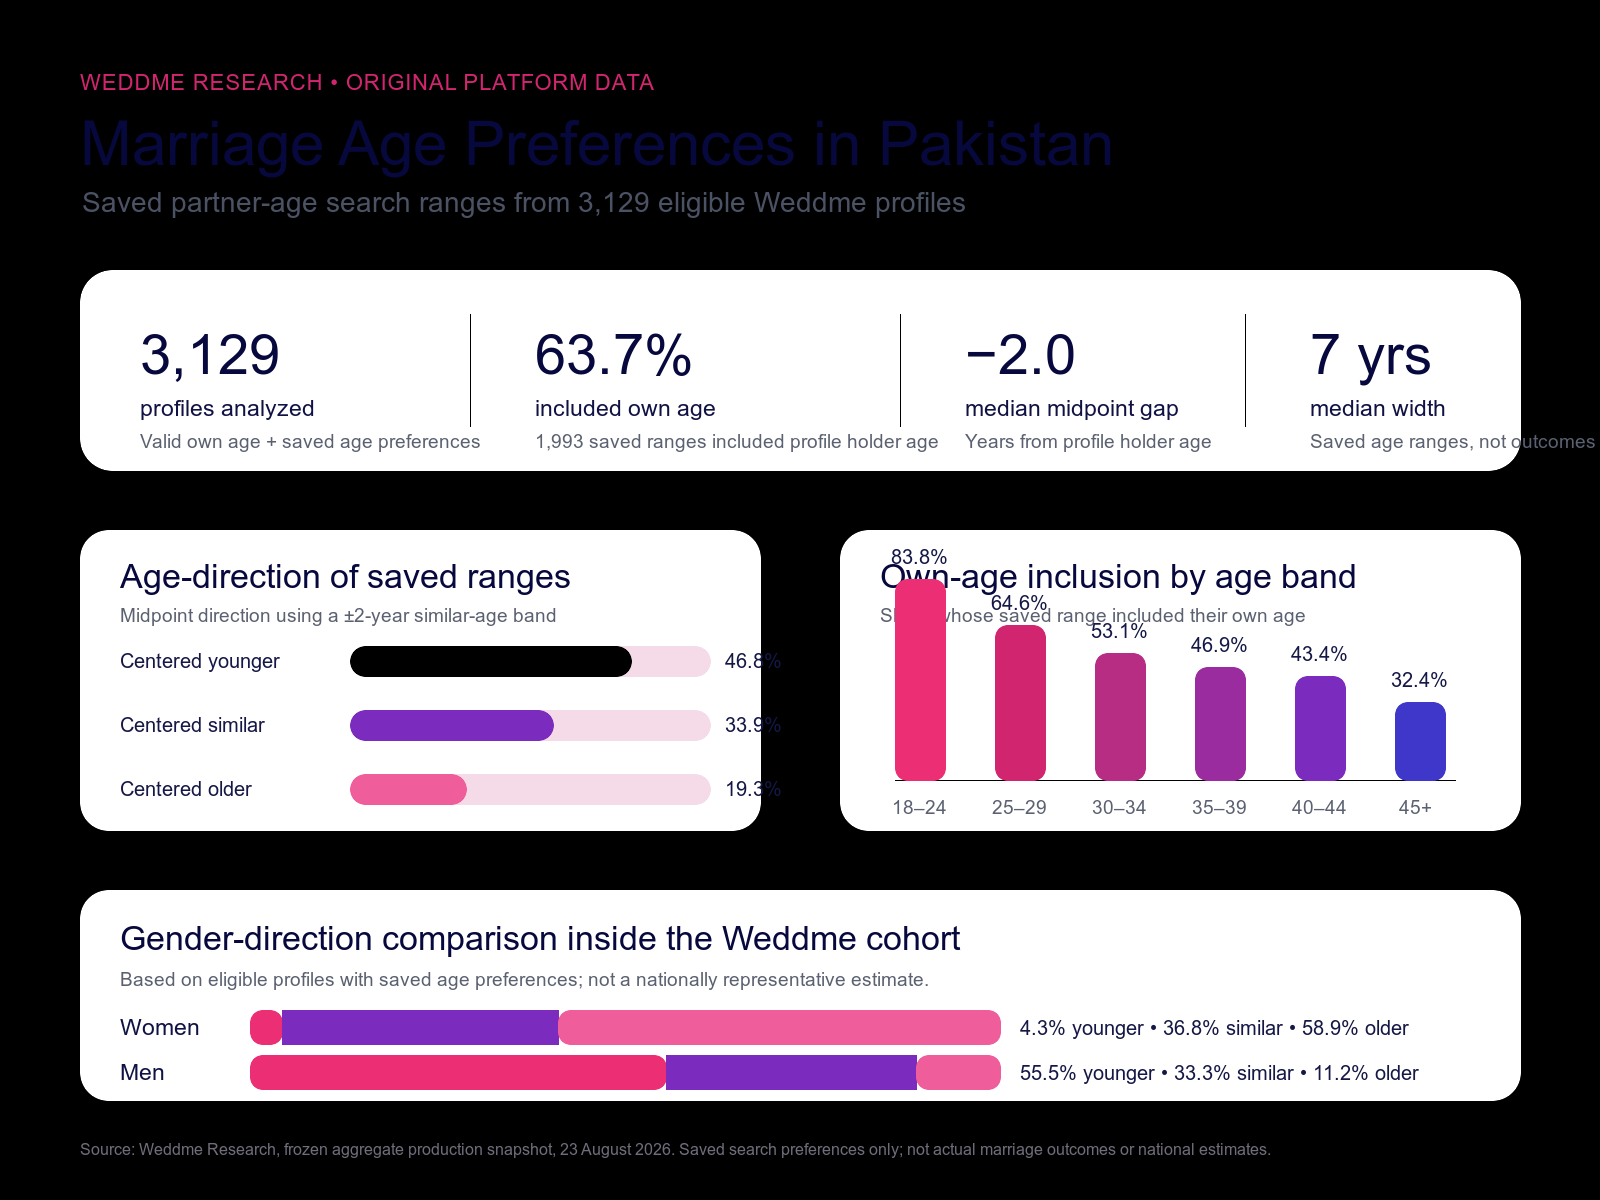
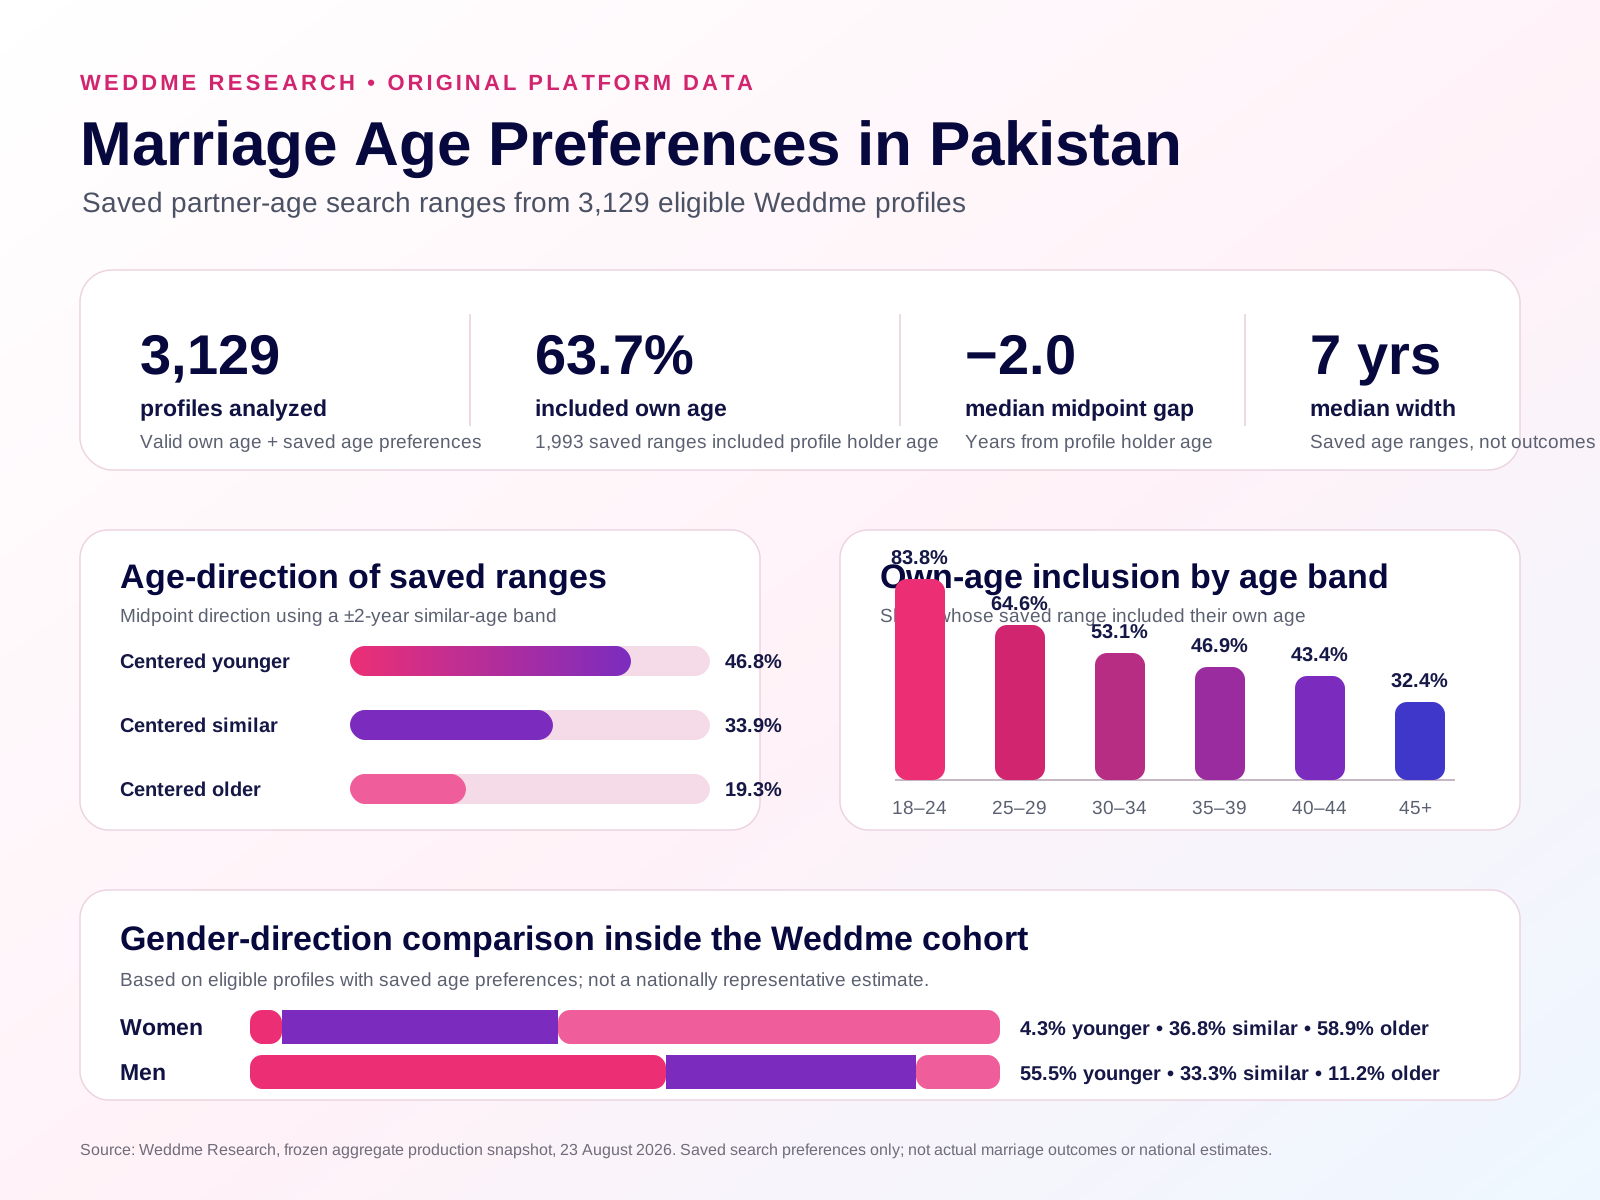
Within the final analytical cohort, the median profile holder age was 27. The median midpoint gap was -2.0 years, meaning the median saved range was centered two years below the profile holder's own age. The median range width was 7 years. A range-relation analysis showed that 63.7% of profiles saved an age range that included the profile holder's own age.
Using a ±2-year “similar-age” band around the profile holder's own age, 46.8% of profiles had saved ranges centered younger, 33.9% were centered around a similar age, and 19.3% were centered older. A second classification showed that 63.7% of profiles had saved ranges that included the profile holder's own age, even when the range leaned younger or older.
Gender patterns were clear but must be stated carefully. Among eligible men's profiles in the analyzed cohort, saved ranges were more frequently centered younger: 55.5% centered younger, 33.3% centered similar age, and 11.2% centered older. Among eligible women's profiles, saved ranges were more frequently centered older: 58.9% centered older, 36.8% centered similar age, and 4.3% centered younger. This describes Weddme's analyzed cohort, not Pakistani men or women nationally.
Age preferences also changed with the profile holder's own age. Among profiles aged 18–24, the median midpoint gap was 0.0 years and 83.8% of saved ranges included the profile holder's own age. In older cohorts, ranges were more often centered below the profile holder's age and own-age inclusion declined. Among profiles aged 45 and above, the median midpoint gap was -9.0 years and 32.4% included the profile holder's own age.
City and education differences were smaller than the gender and own-age patterns. Lahore, Islamabad, and Rawalpindi had the same median midpoint gap of -2.0 years, despite differences in median own age and range width. Bachelor's, master's, higher-secondary, secondary, professional, and doctorate groups also clustered around a median midpoint gap between -1.5 and -2.5 years.
The strongest conclusion is methodological as much as social: matrimonial age expectations on a digital platform are better understood as ranges, not single target ages. Those ranges organize discovery. They do not determine compatibility, seriousness, family acceptance, or marriage.
2. Key Findings
Finding 1: Saved age preferences were common, but not universal
The eligible production snapshot contained 5,783 active client profiles. Age-preference records existed for 3,131 profiles. The final analytical cohort contained 3,129 profiles with valid own-age data and at least one valid saved age band.
This means 54.1% of eligible profiles entered the final age-preference analysis. The remaining profiles either did not have a saved age-preference record or did not have valid own-age data. They were not silently removed; they are documented in the sample flow.
Finding 2: The median saved range was broad, with a 7-year median width
Across 3,129 analyzed profiles, the median profile holder age was 27. The median preferred minimum age was 18, the median preferred maximum age was 30, and the median preferred midpoint was 26.5.
The median midpoint gap was -2.0 years. In this report, a negative midpoint gap means the saved acceptable range is centered below the profile holder's own age.
Finding 3: Nearly half of saved ranges were centered younger, but most ranges still included the profile holder's own age
Using a ±2-year similar-age band:
Saved age-range midpoint direction
| Midpoint direction | Profiles | Share |
|---|---|---|
| Centered younger | 1,463 | 46.8% |
| Centered similar age | 1,061 | 33.9% |
| Centered older | 605 | 19.3% |
A second range-relation method gives more nuance:
Own age and saved age-range relationship
| Relationship between own age and saved range | Profiles | Share |
|---|---|---|
| Includes own age, centered similar | 1,061 | 33.9% |
| Entire range younger | 807 | 25.8% |
| Includes own age, younger-leaning | 656 | 21.0% |
| Entire range older | 329 | 10.5% |
| Includes own age, older-leaning | 276 | 8.8% |
Together, 1,993 profiles, or 63.7% of the analytical cohort, had saved ranges that included the profile holder's own age.
Finding 4: Men's and women's profile groups had different saved age-direction patterns
Among eligible men's profiles with valid saved age preferences, the median midpoint gap was -2.5 years. Among eligible women's profiles, it was +3.0 years.
Age direction by gender
| Gender of profile holder | Profiles | Median midpoint gap | Centered younger | Centered similar | Centered older | Includes own age |
|---|---|---|---|---|---|---|
| Women | 533 | +3.0 years | 4.3% | 36.8% | 58.9% | 56.7% |
| Men | 2,596 | -2.5 years | 55.5% | 33.3% | 11.2% | 65.1% |
These are platform observations. They do not prove national gender preferences, final marriage decisions, family authority, or actual spouse-age gaps.
Finding 5: Own age showed one of the strongest descriptive relationships with saved age-range patterns
The older the profile holder cohort, the more frequently saved ranges were centered below the profile holder's age.
Age preferences by profile holder age
| Own-age band | Profiles | Median own age | Median midpoint gap | Median range width | Includes own age |
|---|---|---|---|---|---|
| 18–24 | 650 | 23 | 0.0 years | 7 years | 83.8% |
| 25–29 | 1,499 | 26 | -2.0 years | 7 years | 64.6% |
| 30–34 | 569 | 31 | -3.5 years | 9 years | 53.1% |
| 35–39 | 224 | 36 | -6.0 years | 9 years | 46.9% |
| 40–44 | 113 | 42 | -7.5 years | 9 years | 43.4% |
| 45+ | 74 | 47 | -9.0 years | 9 years | 32.4% |
This pattern is descriptive. It does not explain why ranges change with age, and it may reflect gender composition, marital history, and platform participation as well as personal preference.
Finding 6: City and education differences were modest compared with gender and own-age patterns
Among city cohorts meeting the public threshold of at least 50 profiles, Lahore, Islamabad, and Rawalpindi all had a median midpoint gap of -2.0 years. Faisalabad had a median midpoint gap of -3.5 years, but its displayed cohort was much smaller at n=55, so the result should be interpreted cautiously.
Education groups also clustered closely. Bachelor's, master's, higher-secondary, secondary, professional, and doctorate groups all had median midpoint gaps between -1.5 and -2.5 years.
3. Why Marriage-Age Preferences Matter
Age is one of the most visible filters in matrimonial search. Families and individuals may use it to think about life stage, education, career timing, fertility expectations, financial readiness, remarriage, parental comfort, social acceptability, and practical compatibility. In many rishta conversations, age is discussed early because it appears to offer a quick signal.
That signal can easily be overinterpreted. A person is not compatible or incompatible only because of age. A saved range cannot measure maturity, temperament, religiosity, consent, household values, financial stability, emotional readiness, or whether two families can communicate respectfully.
Still, age preferences matter because they organize discovery. If a platform asks members to save an acceptable partner-age range, that range shapes which profiles feel immediately relevant. It can widen the search, narrow the search, or place early boundaries around introductions.
The public demographic literature usually measures something different. National surveys such as the Pakistan Demographic and Health Survey describe age at marriage and related outcomes. A PLOS One analysis of all PDHS waves found gradual increases in women's age at first marriage, with 2017–18 mean age at marriage for currently married women over age 25 falling between 19.4 and 20.0 years across age cohorts, and close to 20 years for women born around 1990. UNICEF's child-marriage data portal reports that 18.3% of women aged 20–24 in Pakistan in 2018 had married before age 18, down from 40.7% in 1993.
Those sources are essential, but they answer a different question. They measure marriage timing and child-marriage prevalence. Weddme's data measures saved partner-age ranges inside a digital matrimonial search environment. It is not a substitute for national demographic evidence. It is a complementary view of how some active matrimonial searchers structure the opening stage of discovery.
4. What This Study Measures
A saved age preference is a search parameter. It is not an observed marriage outcome.
Weddme Research, 2026
This report measures saved partner-age preferences attached to eligible Weddme profiles. The relevant field is a multi-select age-group preference stored under ageGroups in user_profile_preferences.
Available preference bands were:
| Saved age band | Analytical interpretation |
|---|---|
| 18–25 | 18 to 25 |
| 26–30 | 26 to 30 |
| 31–35 | 31 to 35 |
| 36–40 | 36 to 40 |
| 41–45 | 41 to 45 |
| 46–50 | 46 to 50 |
| 51+ | 51 to 60 for midpoint/range calculations |
The 51+ band is open-ended in the product interface. For midpoint and width calculations, it was capped at 60 to avoid an infinite upper bound. Only 52 profiles in the final analytical cohort selected 51+, equal to 1.7% of the cohort, so this assumption has limited influence on headline results. The report does not claim to measure preferences above age 60 precisely.
Reviewer-requested sensitivity checks were run before publication. The headline median midpoint gap remained -2.0 years when the 51+ band was treated as 51–55, treated as 51–60, or excluded entirely by removing profiles that selected 51+. The median range width remained 7 years under all three treatments.
Because the field is multi-select, a member can save more than one age band. For each profile, this report collapses selected bands into one analytical range:
Preferred minimum age = lowest selected band minimum
Preferred maximum age = highest selected band maximum
Preferred midpoint = (minimum + maximum) / 2
Preferred range width = maximum - minimum
Midpoint gap = preferred midpoint - profile holder age
Example:
Own age: 28
Saved bands: 18–25 and 26–30
Analytical range: 18–30
Midpoint: 24
Midpoint gap: -4 years
This method captures the full acceptable range expressed by selected bands. It does not assume that every age inside the range is equally preferred.
A separate contiguity audit was run because collapsing multiple bands into one minimum-to-maximum range can create artificial in-between ages when selections are non-contiguous. Among 1,378 profiles that selected more than one valid age band, 17 had non-contiguous selections, equal to 1.23% of multi-band profiles and 0.54% of the final analytical cohort. Because non-contiguous selections were rare, the continuous-range method was retained for the main report. This limitation should still be kept in mind when interpreting individual examples of range width.
5. Dataset and Sample Flow
The data was captured from production in one repeatable-read, read-only transaction. No names, emails, phone numbers, photographs, message contents, payment records, or row-level identifiers are included in this public draft.
Eligibility required:
- active client user;
- active profile;
- no deleted user or profile record;
- valid user flag set to true;
- user not flagged;
- clean risk state;
- profile age between 18 and 80 for analytical use;
- at least one valid saved age preference band.
Sample flow:
| Step | Profiles |
|---|---|
| Eligible active client profiles | 5,783 |
| Profiles with valid own age | 5,779 |
| Profiles with an age-preference record | 3,131 |
| Final analytical cohort with valid own age and valid saved age preference | 3,129 |
| Invalid or missing own age | 4 |
| Missing age-preference record | 2,652 |
| Preference record without valid token | 0 |
| Profiles with any invalid preference token | 0 |
The final analytical cohort is therefore not the whole eligible Weddme population. It is the subset for which the age-preference question can be analyzed responsibly.
6. Data Validation
Before analysis, the age-preference field was audited for missing values, invalid tokens, impossible ages, minimum greater than maximum, and open-ended bands.
The validation found:
- four eligible profiles had missing or invalid own-age values;
- 2,652 eligible profiles had no age-preference record;
- every profile with a saved age-preference record had at least one valid age token;
- no saved token had a minimum below 18;
- no saved token had a maximum below its minimum;
- no saved token exceeded the analytical maximum of 80 after applying the 51+ cap;
- only 17 multi-band profiles had non-contiguous age-band selections;
- 83.6% of final-cohort age preferences were created on the same calendar day as the profile;
- 0.0% had an
updated_atvalue more than one minute aftercreated_at.
The last two points are important. The database shows that most saved age preferences were created close to profile creation and were not later edited. Current Weddme web and mobile onboarding code does not preselect an age range; an empty age-preference step remains empty until the user chooses one or more age bands. Saving that multi-select preference step requires at least one selected option. However, the database cannot reveal how much thought each user gave to the field, whether a family member helped choose the range, or whether a member would choose the same range later. For that reason, the report describes these as saved search parameters rather than deep personal preferences.
7. How Age Direction Is Defined
The report uses two complementary definitions.
7.1 Midpoint direction
For each profile:
Own age = A
Preferred minimum = MIN
Preferred maximum = MAX
Preferred midpoint = M = (MIN + MAX) / 2
Midpoint gap = D = M - A
The direction categories are:
| Category | Definition |
|---|---|
| Centered younger | D < -2 years |
| Centered similar age | -2 ≤ D ≤ +2 years |
| Centered older | D > +2 years |
The ±2-year similar-age band was selected before public interpretation because the underlying preference choices are grouped into broad bands rather than exact ages. A narrower threshold would overstate precision; a much wider threshold would hide meaningful differences.
7.2 Range relation
Midpoints alone can hide whether the profile holder's own age is inside the acceptable range. The report therefore also classifies the relationship between own age and saved range:
| Category | Definition |
|---|---|
| Entire range younger | preferred maximum is below own age |
| Entire range older | preferred minimum is above own age |
| Includes own age, centered similar | own age is inside the range and midpoint gap is within ±2 years |
| Includes own age, younger-leaning | own age is inside the range and midpoint gap is below -2 years |
| Includes own age, older-leaning | own age is inside the range and midpoint gap is above +2 years |
This second method is often more intuitive. A 35-year-old whose saved range is 26–40 has a younger-centered range, but the range still includes 35. That is different from a 35-year-old whose saved range is 18–30.
8. Overall Preference Landscape
The most frequently selected age bands were 18–25 and 26–30. Because users could select multiple bands, percentages below do not add to 100.
Saved age band
| Saved age band | Profiles selecting band | Share of analytical cohort |
|---|---|---|
| 18–25 | 1,927 | 61.6% |
| 26–30 | 1,708 | 54.6% |
| 31–35 | 933 | 29.8% |
| 36–40 | 425 | 13.6% |
| 41–45 | 215 | 6.9% |
| 46–50 | 106 | 3.4% |
| 51+ | 52 | 1.7% |
The distribution shows why age preferences should be treated as ranges. Many profiles selected adjacent bands, producing wider acceptable windows than a single age label would suggest.
Across all analyzed profiles:
| Metric | Value |
|---|---|
| Median own age | 27 |
| Median preferred minimum | 18 |
| Median preferred maximum | 30 |
| Median preferred midpoint | 26.5 |
| Median midpoint gap | -2.0 years |
| Mean midpoint gap | -1.6 years |
| Midpoint gap Q1 | -4.5 years |
| Midpoint gap Q3 | +1.5 years |
| Median range width | 7 years |
| Mean range width | 9.5 years |
| Median younger-side allowance | 7 years |
| Median older-side allowance | 3 years |
The median profile therefore allowed more room below the profile holder's own age than above it. But the interquartile range of midpoint gaps, from -4.5 to +1.5 years, also shows substantial variation.
9. Younger, Similar-Age and Older Partner Directions
Only 25.8% of profiles had a saved range wholly below their own age; most ranges included the profile holder’s own age.
Weddme Research, 2026
Midpoint direction gives the simplest summary:
Direction
| Direction | Profiles | Share |
|---|---|---|
| Centered younger | 1,463 | 46.8% |
| Centered similar age | 1,061 | 33.9% |
| Centered older | 605 | 19.3% |
The range-relation method shows why this should not be simplified into “younger versus older.”
Own age and saved age-range relationship
| Range relation | Profiles | Share |
|---|---|---|
| Includes own age, centered similar | 1,061 | 33.9% |
| Entire range younger | 807 | 25.8% |
| Includes own age, younger-leaning | 656 | 21.0% |
| Entire range older | 329 | 10.5% |
| Includes own age, older-leaning | 276 | 8.8% |
Only 25.8% of profiles had a saved range wholly below their own age. Another 21.0% had ranges that leaned younger but still included their own age. Similarly, 10.5% had a range wholly above their own age, while 8.8% had an older-leaning range that still included their own age.
For product and research purposes, this distinction matters. A profile with a younger-leaning but inclusive range may be more flexible than the midpoint alone suggests.
10. Preferred Age Gap
In this report, “preferred age gap” means the difference between the profile holder's own age and the midpoint of the saved acceptable partner-age range. It is not an actual spouse-age gap.
The distribution was concentrated around small midpoint gaps but skewed younger:
Preferred midpoint gap distribution
| Midpoint gap band | Profiles | Share |
|---|---|---|
| -12 years or more | 93 | 3.0% |
| -9 to -11.9 years | 122 | 3.9% |
| -6 to -8.9 years | 299 | 9.6% |
| -3 to -5.9 years | 779 | 24.9% |
| Midpoint gap between -2.9 and +2.9 years | 1,285 | 41.1% |
| +3 to +5.9 years | 314 | 10.0% |
| +6 to +8.9 years | 134 | 4.3% |
| +9 to +11.9 years | 43 | 1.4% |
| +12 years or more | 60 | 1.9% |
The largest single band was the midpoint-gap band between -2.9 and +2.9 years. This descriptive band is separate from the formal ±2-year “centered similar age” classification used in the midpoint-direction analysis. At the same time, a substantial share of profiles were clustered three to six years below the profile holder's own age.
11. How Preferences Change With the Searcher's Own Age
Own age was one of the strongest descriptive patterns.
Age preferences by profile holder age
| Own-age band | N | Median own age | Median preferred midpoint | Median midpoint gap | Centered younger | Centered similar | Centered older | Includes own age |
|---|---|---|---|---|---|---|---|---|
| 18–24 | 650 | 23 | 21.5 | 0.0 | 19.2% | 49.4% | 31.4% | 83.8% |
| 25–29 | 1,499 | 26 | 24.0 | -2.0 | 47.2% | 35.0% | 17.7% | 64.6% |
| 30–34 | 569 | 31 | 28.0 | -3.5 | 59.1% | 26.0% | 14.9% | 53.1% |
| 35–39 | 224 | 36 | 30.5 | -6.0 | 68.8% | 17.9% | 13.4% | 46.9% |
| 40–44 | 113 | 42 | 33.0 | -7.5 | 71.7% | 17.7% | 10.6% | 43.4% |
| 45+ | 74 | 47 | 38.0 | -9.0 | 79.7% | 9.5% | 10.8% | 32.4% |
Younger profile holders were more likely to include their own age. Among 18–24-year-olds, 83.8% of saved ranges included the profile holder's own age. Among the 45+ group, that share was 32.4%.
The median range width also increased modestly after age 30. The 18–24 and 25–29 groups had median widths of 7 years. The 30–34, 35–39, 40–44, and 45+ groups had median widths of 9 years.
This does not mean that age itself causes a preference shift. Older cohorts differ in gender composition, marital history, life stage, and platform participation. The result should be read as a descriptive pattern within the Weddme cohort.
12. Gender Patterns
Gender-direction findings describe eligible Weddme profiles with saved preferences, not Pakistani men or women nationally.
Weddme Research, 2026
Gender comparisons are likely to attract attention, so the wording here is deliberately precise.
Among eligible men's profiles in the analyzed Weddme cohort, saved age ranges were more frequently centered below the profile holder's own age. Among eligible women's profiles, saved age ranges were more frequently centered above the profile holder's own age.
| Gender | N | Median own age | Median preferred midpoint | Median midpoint gap | Median range width | Centered younger | Centered similar | Centered older | Includes own age |
|---|---|---|---|---|---|---|---|---|---|
| Women | 533 | 27 | 30.5 | +3.0 | 4 years | 4.3% | 36.8% | 58.9% | 56.7% |
| Men | 2,596 | 27 | 24.0 | -2.5 | 7 years | 55.5% | 33.3% | 11.2% | 65.1% |
The women's profile group had a narrower median range width: 4 years, compared with 7 years for men's profiles. Women's saved ranges were also more often centered older. Men's saved ranges were more often centered younger and more often included their own age.
Age-specific gender tables show that the direction difference was not limited to one age group:
| Gender | Own-age band | N | Median midpoint gap | Centered younger | Centered similar | Centered older | Includes own age |
|---|---|---|---|---|---|---|---|
| Women | 18–24 | 116 | +4.0 | 0.9% | 28.4% | 70.7% | 38.8% |
| Women | 25–29 | 234 | +3.0 | 3.0% | 35.5% | 61.5% | 59.4% |
| Women | 30–34 | 105 | +2.5 | 2.9% | 46.7% | 50.5% | 62.9% |
| Men | 18–24 | 534 | -0.5 | 23.2% | 53.9% | 22.8% | 93.6% |
| Men | 25–29 | 1,265 | -3.0 | 55.4% | 34.9% | 9.6% | 65.5% |
| Men | 30–34 | 464 | -4.5 | 71.8% | 21.3% | 6.9% | 50.9% |
| Men | 35–39 | 181 | -7.0 | 82.9% | 11.0% | 6.1% | 40.9% |
| Men | 40–44 | 91 | -9.0 | 84.6% | 13.2% | 2.2% | 37.4% |
| Men | 45+ | 61 | -12.0 | 90.2% | 6.6% | 3.3% | 29.5% |
Women's cohorts above age 34 did not meet the public subgroup threshold and are not displayed. Absence from the table does not mean absence from the platform.
These results should not be translated into national statements such as “Pakistani men prefer younger women” or “Pakistani women prefer older men.” The accurate interpretation is narrower: among eligible Weddme profiles with saved age preferences, men's and women's profile groups showed different age-direction patterns.
13. City-Level Variation
Only city cohorts with at least 50 profiles are displayed.
| City | N | Median own age | Median preferred midpoint | Median midpoint gap | Median range width | Centered younger | Centered similar | Centered older | Includes own age |
|---|---|---|---|---|---|---|---|---|---|
| Lahore | 1,281 | 26 | 24.0 | -2.0 | 7 years | 46.8% | 33.8% | 19.4% | 62.5% |
| Islamabad | 590 | 28 | 26.5 | -2.0 | 9 years | 45.8% | 33.1% | 21.2% | 63.2% |
| Rawalpindi | 512 | 28 | 26.5 | -2.0 | 7 years | 47.5% | 31.1% | 21.5% | 61.7% |
| Faisalabad | 55 | 26 | 24.0 | -3.5 | 7 years | 60.0% | 29.1% | 10.9% | 65.5% |
The three largest displayed city cohorts were broadly similar. Lahore, Islamabad, and Rawalpindi all had a median midpoint gap of -2.0 years. Islamabad had a slightly wider median range width, at 9 years, compared with 7 years in Lahore and Rawalpindi.
Faisalabad differed in direction share, but the cohort was much smaller. It should not be used to characterize Faisalabad residents or families.
14. Education and Age Preferences
Education categories are self-reported profile fields. Only categories with at least 50 profiles are displayed.
Age preferences by education group
| Education level | N | Median own age | Median preferred midpoint | Median midpoint gap | Median range width | Centered younger | Centered similar | Centered older | Includes own age |
|---|---|---|---|---|---|---|---|---|---|
| Bachelor's | 1,449 | 26 | 24.0 | -2.0 | 7 years | 45.8% | 35.3% | 18.8% | 65.1% |
| Master's | 699 | 30 | 28.0 | -2.0 | 9 years | 48.6% | 30.2% | 21.2% | 59.1% |
| Higher secondary | 449 | 26 | 24.0 | -1.5 | 7 years | 45.2% | 36.3% | 18.5% | 66.8% |
| Diploma | 198 | 27 | 24.0 | -2.5 | 7 years | 54.5% | 30.3% | 15.2% | 61.1% |
| Secondary | 154 | 26 | 24.0 | -1.5 | 7 years | 44.2% | 36.4% | 19.5% | 63.0% |
| Professional | 115 | 26 | 26.5 | -2.0 | 9 years | 43.5% | 33.0% | 23.5% | 67.0% |
| Doctorate | 54 | 31 | 30.5 | -2.0 | 8 years | 48.1% | 29.6% | 22.2% | 57.4% |
The most important result is the lack of a large education split in median midpoint gap. Displayed education groups clustered near -2 years. Master's and professional profiles had wider median ranges than most other displayed groups, but this is descriptive and not causal.
The broader literature on assortative marriage often treats education and age gaps together. A comparative South and Southeast Asia study defines age homogamy as spouses being similar in age, age hypergamy as husband older than wife, and age hypogamy as wife older than husband. It also reports that educational differences were not very prominent in explaining age-gap differences across the region. Weddme's education findings are consistent with caution: education may structure matrimonial search, but these data do not prove that education causes a particular age preference.
15. Profession-Level Patterns
Profession is self-reported and unevenly distributed, and apparent occupation-level differences may mainly reflect gender and age composition. For that reason, detailed profession results are not interpreted in the main report.
Among profession groups with at least 100 analyzed profiles, median midpoint gaps ranged from +1.5 years to -3.5 years. These differences are presented only as appendix-level descriptive results. They should not be summarized as “doctors prefer,” “teachers prefer,” or “engineers prefer” because the analysis is not adjusted for gender, own age, city, marital status, or education.
16. Marital-Status Patterns
Marital-status comparisons can be sensitive and should be written neutrally. The categories below are self-reported profile fields and are shown only where the cohort met the public threshold.
Age preferences by marital status
| Marital status | N | Median own age | Median preferred midpoint | Median midpoint gap | Median range width | Centered younger | Centered similar | Centered older | Includes own age |
|---|---|---|---|---|---|---|---|---|---|
| Never married | 2,470 | 26 | 24.0 | -2.0 | 7 years | 45.6% | 36.3% | 18.1% | 66.5% |
| Divorced, no children | 227 | 31 | 30.5 | -2.0 | 7 years | 48.9% | 25.6% | 25.6% | 50.2% |
| Separated | 150 | 33 | 29.0 | -4.5 | 12 years | 62.0% | 20.0% | 18.0% | 54.0% |
| Annulled | 117 | 34 | 30.5 | -2.5 | 9 years | 51.3% | 28.2% | 20.5% | 59.8% |
| Divorced, with children | 106 | 34 | 33.0 | -1.5 | 9 years | 44.3% | 25.5% | 30.2% | 50.0% |
The never-married group was younger on average and had the largest displayed cohort. Previously married categories tended to have older median own ages and, in some cases, wider acceptable ranges. That observation should not be framed as flexibility, desperation, stigma, or lower preference. It only describes stored search parameters.
17. How Broad Are Acceptable Age Ranges?
The median saved range width was 7 years. The distribution was:
Saved age-range width distribution
| Range width band | Profiles | Share |
|---|---|---|
| 0–4 years | 771 | 24.6% |
| 5–9 years | 1,230 | 39.3% |
| 10–14 years | 679 | 21.7% |
| 15–19 years | 305 | 9.7% |
| 20+ years | 144 | 4.6% |
The most common width category was 5–9 years. About one quarter of analyzed profiles saved narrow ranges of 0–4 years, while 14.3% saved ranges of at least 15 years.
Range width is not automatically a measure of seriousness or openness. A narrow range may reflect firm family expectations, product defaults, or a clear life-stage preference. A wider range may reflect genuine openness, uncertainty, remarriage context, or simply selecting several adjacent bands. The data records the range, not the reason.
18. What These Patterns May Mean for Digital Matrimony
The findings suggest four practical points about digital matrimonial search.
First, age preferences are structured as ranges. Product design, research, and family conversations should avoid treating age expectations as single target ages.
Second, midpoint direction and own-age inclusion should be separated. A younger-leaning range may still include the profile holder's own age. A profile can therefore appear directional while remaining inclusive.
Third, own age matters. As profile holder age rises, saved ranges tend to be centered further below own age and become less likely to include own age. This pattern is visible in the aggregate cohort and especially in men's age cohorts that met the public threshold.
Fourth, subgroup differences should be interpreted conservatively. City and education differences were modest. Profession and marital-status differences are more vulnerable to composition effects. A public report should describe them, not over-explain them.
For Weddme and similar platforms, the implication is straightforward: age filters should help users organize discovery, but the interface should not encourage users to treat age as a substitute for complete profile review, consent, respectful communication, family discussion, and independent verification.
19. Conclusion
This report's central finding is that partner-age expectations in digital matrimonial search are best understood as ranges. The median analyzed Weddme profile saved a 7-year acceptable partner-age window, with a midpoint two years below the profile holder's own age. But that single summary hides important structure: most ranges included the profile holder's own age, gender groups showed different midpoint directions, and own-age cohorts differed substantially in how far saved ranges leaned below or above the profile holder's age.
The most defensible interpretation is practical rather than sensational. Age preferences help organize discovery, but they do not settle compatibility, family acceptance, seriousness, consent, or marriage outcomes. Weddme data adds evidence about the search stage of Pakistan's digital rishta journey; it should be read alongside, not in place of, demographic research on actual age at marriage.
20. What the Data Cannot Tell Us
This study has important limits.
First, Weddme profiles are not representative of Pakistan. The cohort is shaped by internet access, platform awareness, advertising exposure, city coverage, self-selection, profile completion, and eligibility rules.
Second, saved age ranges are not marriage outcomes. They do not show who married whom, whether conversations succeeded, whether families approved, or whether the final spouse-age gap matched the saved range.
Third, a saved preference cannot reveal motive. The same age range may reflect personal preference, family guidance, perceived social acceptability, registration flow, uncertainty, or a desire to keep options open.
Fourth, the profile manager and the person represented may not be the same person. The data cannot identify who selected or confirmed the preference.
Fifth, the preference field uses bands, not exact ages. This report estimates midpoint and range width from grouped choices.
Sixth, the 51+ band is open-ended. It was capped at 60 for analytical midpoint calculations, and the report does not interpret preferences above 60 precisely.
Seventh, subgroup statistics are unadjusted. Differences by city, education, profession, or marital status may reflect gender, age composition, platform acquisition source, or other factors not modeled here.
Eighth, the report does not include commercially sensitive operating metrics such as response rates, match success, payment conversion, subscription behavior, churn, rejection, or marriage outcomes.
21. Methodological Notes
21.1 Frozen snapshot
The analysis was run in a repeatable-read, read-only production database transaction on 23 August 2026 at 05:44:54 UTC, equivalent to 10:44:54 Pakistan Standard Time.
21.2 Eligibility rules
The cohort included active client users with active profiles. Deleted users and profiles were excluded. Invalid users, flagged users, and non-clean-risk users were excluded. Non-client accounts were excluded.
21.3 Age validity
Profile holder age was taken from the profile's stored age field and considered valid for this report when it fell between 18 and 80 inclusive. Four eligible profiles had invalid or missing own-age data and were excluded from the analytical cohort.
21.4 Preference parsing
The age preference field was stored as JSON text under ageGroups or equivalent normalized category naming. Values were parsed as selected age bands. Each band was converted into a lower and upper bound. Multiple selected bands were collapsed into one range using the lowest selected minimum and highest selected maximum.
21.5 Direction classification
The preferred midpoint was calculated as the average of preferred minimum and maximum. The midpoint gap was calculated as preferred midpoint minus profile holder age. A ±2-year band defined similar-age midpoint direction.
21.6 Contiguity and open-ended-band sensitivity
A contiguity audit checked whether multi-band selections formed uninterrupted age-band sequences. Non-contiguous selections were rare: 17 profiles, equal to 1.23% of multi-band profiles and 0.54% of the final analytical cohort.
The 51+ open-ended band was tested three ways: treating it as 51–55, treating it as 51–60, and excluding profiles that selected 51+. The headline median midpoint gap remained -2.0 years and the median range width remained 7 years under all three treatments.
21.7 Subgroup thresholds
Public subgroup tables required at least 50 profiles. Profession tables required at least 100 profiles because profession categories were more fragmented and more vulnerable to overinterpretation. Smaller groups were suppressed or left for internal review.
21.8 Privacy
The public report uses grouped statistics only. It does not publish user IDs, names, emails, phone numbers, photographs, biographies, message content, exact birth dates, or row-level records. No chat, payment, subscription, or outcome data was used.
22. Data and Citation Note
The public report should cite the frozen aggregate extract rather than any live production count. Future Weddme profile counts may change as users register, update preferences, or leave the platform. If this report is updated later, the update should either preserve the 23 August 2026 snapshot as a historical release or clearly identify a new snapshot date and revised cohort.
The underlying public dataset should remain aggregate-only. Any downloadable chart pack or media kit should include subgroup counts, percentages, and definitions, but not row-level user records.
26. References
Weddme Research
- Weddme Research. Pakistan Matrimonial Trends Report 2026. Published 2026.
- Weddme Research. Pakistan's Digital Matrimonial Transformation 2026. Published 2026.
- Weddme Research. Family Participation in Pakistan's Digital Matrimony. Published 2026.
- Weddme Research. Marriage Age Preferences in Pakistan: Frozen Aggregate Research Extract. Internal read-only dataset, snapshot 23 August 2026 at 10:44:54 PKT. No personal identifiers or message contents included.
External context
- National Institute of Population Studies - NIPS/Pakistan and ICF. (2019). Pakistan Demographic and Health Survey 2017–18. DHS Program.
- Rasul, A., et al. (2022). “Factors associated with female age at first marriage: An analysis using all waves of the Pakistan Demographic and Health Survey.” PLOS One.
- UNICEF. Child Marriage Country Profile: Pakistan.
- UNICEF Data / Child Marriage Data Portal. Child Marriage in Pakistan.
- Dommaraju, P. “Age Gap Between Spouses in South and Southeast Asia.” Comparative study of age homogamy, hypergamy and hypogamy in South and Southeast Asia.
Appendix A. Detailed Profession Results
Profession is self-reported and unevenly distributed, so this appendix uses a stricter publication threshold of at least 100 profiles. These results are descriptive only and should not be interpreted as occupation-driven preference differences.
Appendix: age preferences by profession
| Profession | N | Median own age | Median preferred midpoint | Median midpoint gap | Median range width | Centered younger | Centered similar | Centered older | Includes own age |
|---|---|---|---|---|---|---|---|---|---|
| Business owner | 395 | 27 | 24.0 | -2.5 | 7 years | 51.9% | 34.2% | 13.9% | 64.6% |
| Software engineer | 271 | 26 | 24.0 | -2.5 | 7 years | 51.3% | 32.8% | 15.9% | 72.7% |
| Other | 261 | 26 | 28.0 | 0.0 | 7 years | 34.9% | 31.8% | 33.3% | 57.1% |
| Sales / marketing | 219 | 26 | 24.0 | -2.0 | 7 years | 47.9% | 36.5% | 15.5% | 63.9% |
| Government employee | 185 | 29 | 26.5 | -3.5 | 7 years | 61.6% | 27.6% | 10.8% | 61.6% |
| Teacher | 161 | 29 | 30.5 | +1.5 | 7 years | 27.3% | 34.8% | 37.9% | 55.3% |
| Doctor | 111 | 27 | 26.5 | -0.5 | 7 years | 43.2% | 33.3% | 23.4% | 69.4% |
| Manager | 110 | 29 | 26.5 | -2.8 | 9 years | 51.8% | 30.0% | 18.2% | 60.0% |
Suggested citation
Weddme Research Team. (2026). Marriage Age Preferences in Pakistan: An Evidence-Based Analysis Using Weddme's Matrimonial Platform Data. Weddme Research & Insights. https://weddme.pk/research/marriage-age-preferences-pakistan
Describe the figures as saved age-preference findings from an eligible Weddme platform cohort, not as actual spouse-age gaps or national estimates for Pakistan.
Reporting resources
Download the public summary, editorial cover, chart pack, and aggregate publication data. The public data contains only grouped findings used in this report.